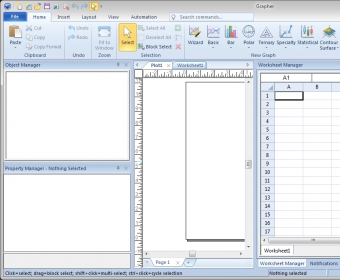
Grapher is one of the most effective graphing applications that I have ever tested. Despite its complexity, this powerful program offers an intuitive way of creating professional graphs. It can be used in a large number of fields, from engineering to economy and finances. Also, students will find all the necessary tools for plotting various functions for their projects.
As a heavy AutoCAD user, I was skeptical about the capabilities of Grapher, but when it comes to graphing and plotting, this program has all it takes. It is even better than other popular programs of this kind. Its interface is well-organized, allowing access to many tools that you can use to create graphs. It supports XLS format and that’s a big plus. You can easily load a spreadsheet containing coordinates, and choose the graph type. The desired graph will be automatically generated, offering you the opportunity to customize it in many ways.
Grapher comes with up to 54 graph types. By using this program you can create 2D graphs (function plot, bar chart, floating bar chart, pie chart, etc.), as well as 3D ones (ribbon, histogram, 3D pie chart, etc.) In addition to this, users can create graphs by using the included Graph Wizard.


Comments (1)